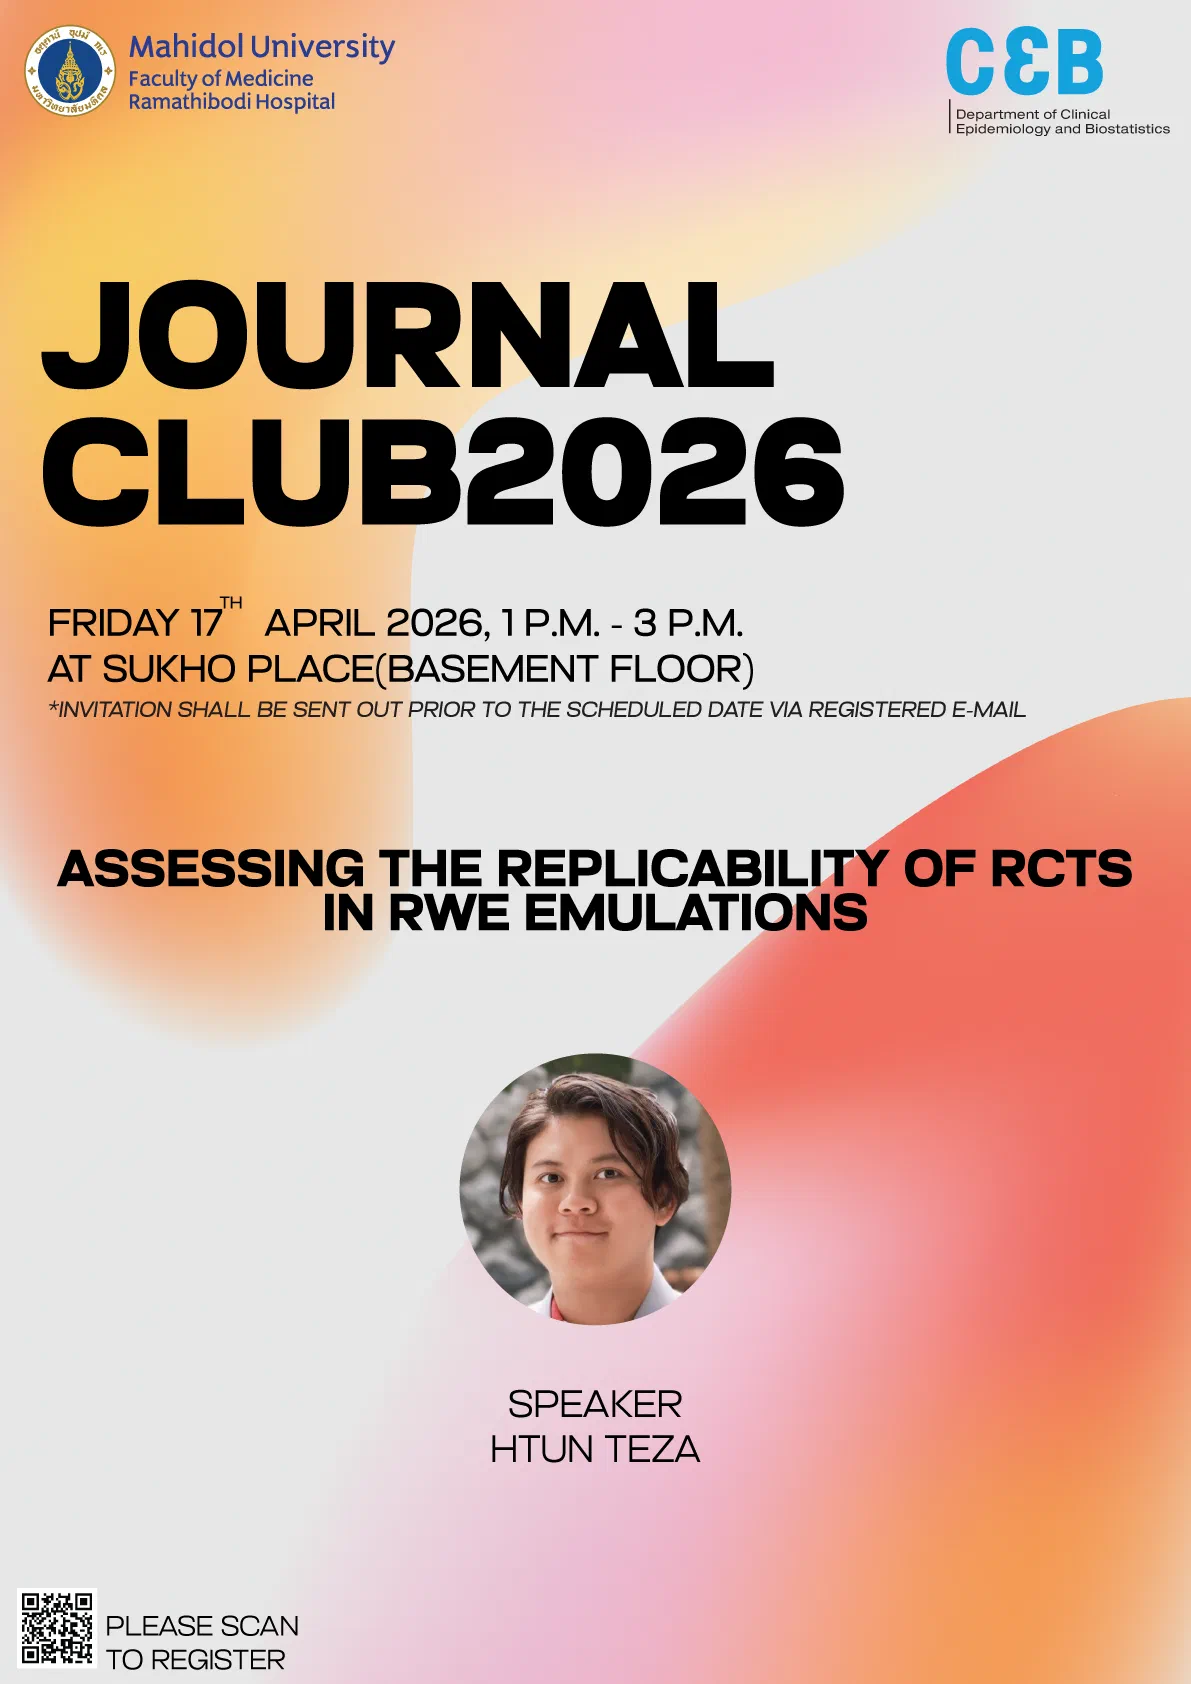
I recently hosted a journal club discussion covering the paper “Assessing the replicability of RCTs in RWE emulations”. The presentation was based on the paper by Jeanette Köppe, Charlotte Micheloud, Stella Erdmann, Rachel Heyard and Leonhard Held, published in BMC Medical Research Methodology (2025). The resources for the Journal Club can be found here.
The Efficacy-Effectiveness Gap
While RCTs are the gold standard for internal validity, they often suffer from low external validity. Trials frequently exclude the very patients seen in routine care—the elderly, those with multi-morbidities, or pregnant patients. RWE emulations bridge this gap by analyzing routine healthcare data.
This paper is produced by the RCT DUPLICATE initiative, standing for “Randomized Controlled Trials Duplicated Using Prospective Longitudinal Insurance Claims: Applying Techniques of Epidemiology”. (They really wanted to make sure their acronyms work.) The initiative has successfully replicated 32 RCTs using RWE, from 3 US claims databases: Optum Clinformatics, MarketScan, and Medicare.
Why the Two-Trials Rule (TTR) Falls Short
The standard regulatory approach, the Two-Trials Rule (TTR) ($p_{TTR} = \max(p_{RCT}, p_{RWE}) \le \alpha$), was originally designed for two confirmatory RCTs of similar design and size. Importing it unchanged into the world of RWE emulations introduces three critical flaws:
1. Sample Size Blindness
The TTR only asks if a study crossed the arbitrary $p \le 0.025$ threshold. Because RWE often utilizes massive administrative or insurance databases, it can achieve “significance” through sheer power, even if the treatment effect is clinically marginal. The TTR treats a massive database that barely scrapes past $p = 0.025$ exactly the same as a smaller, highly convincing study.
2. Effect Size Insensitivity
The TTR focuses on binary direction agreement. If an RCT shows a Hazard Ratio ($HR$) of 0.60 and an RWE emulation shows an $HR$ of 0.95, both may pass the significance test. The TTR would declare this a “success,” despite the results telling two fundamentally different stories about the drug’s effectiveness. It lacks a mechanism to penalize the “distance” between effect sizes.
3. Disregard for Uncertainty and Asymmetry
The TTR assumes “exchangeability”—the idea that both studies are interchangeable units of evidence. However, an RCT and an RWE emulation are structurally different:
- RCTs prioritize internal validity through randomization to control for unknown confounders.
- RWE provides higher precision (smaller standard error) but relies on coded proxies and propensity score matching to control for observed confounders.
By ignoring these differences, the TTR fails to account for the uncertainty inherent in the original RCT. A replication should be held to a higher standard if the original trial was borderline, a nuance that the TTR’s fixed bar completely misses.
The Sceptical P-Value : A Joint Credibility Test
As detailed in my presentation, the Sceptical P-Value ($p_s$) offers a more rigorous alternative. Instead of two separate significance tests, it adopts the perspective of a rational sceptic to test the joint credibility of both studies.
The Mathematical Framework
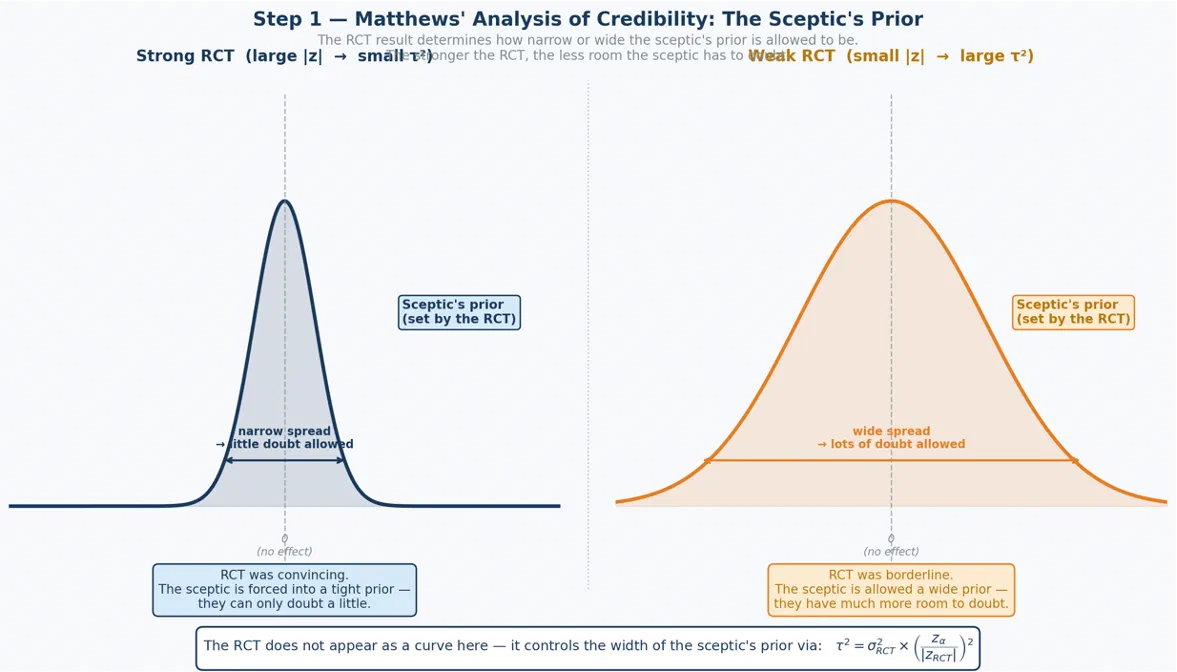
- Matthews’ Analysis of Credibility: We calculate the most extreme prior disbelief ($\tau^2$) the RCT result can survive. As shown in Figure 1, a strong RCT forces the sceptic into a narrower prior, leaving less room for doubt: $$\tau^2 = \sigma_{RCT}^2 \times \left(\frac{z_{\alpha}}{|z_{RCT}|}\right)^2$$
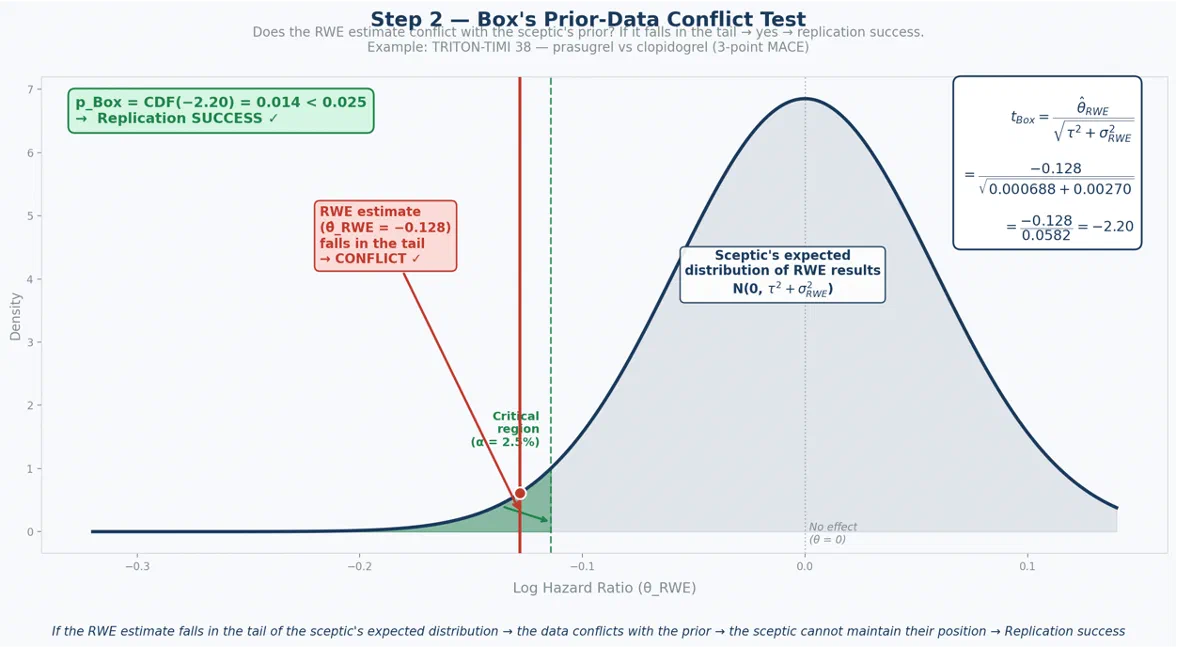
- Box’s Prior-Data Conflict Test: We then evaluate if the RWE data significantly conflicts with this sceptic’s prior: $$t_{Box} = \frac{\theta_{RWE}}{\sqrt{\tau^2 + \sigma_{RWE}^2}}$$
This gives us $p_{Box}$, the probability of observing a result as extreme as ours if the sceptic’s worldview were correct. If $p_{Box}$ is less than our threshold (α), we conclude the data and the sceptic are in significant conflict, and the sceptic’s position is rejected, as shown in Figure 2.
The Tipping Point: From $p_{Box}$ to $p_s$
The $p_{Box}$ value is not static; it depends on our chosen significance level ($\alpha$), which determines the “width” of the sceptic’s disbelief. As we demand a stricter standard (lowering $\alpha$), the sceptic’s prior becomes wider, making it harder for the RWE to generate a conflict. This creates a dynamic chain:
$$\alpha \downarrow \implies z_{\alpha} \uparrow \implies \tau^2 \uparrow \implies t_{Box} \downarrow \implies p_{Box} \uparrow$$The Sceptical P-Value ($p_s$) is the “equilibrium” point where these two values meet ($\alpha = p_{Box}$). It represents the most demanding threshold the RWE can survive while still forcing the sceptic to abandon their position. While $p_{Box}$ tells you if the sceptic is rejected at a fixed level, $p_s$ provides a single, continuous measure of replication success.
Replication is only declared successful if the RWE evidence is strong enough to reach this equilibrium at an acceptable level. (Typically $p_s < 0.025$)
Case Study: TRITON-TIMI 38
Resources:
- Original Trial: Wiviott et al., NEJM 2007
- Emulation Data: Wang et al., JAMA 2023
To illustrate the $p_s$ framework, we applied it to the TRITON-TIMI 38 trial (Prasugrel vs. Clopidogrel) and its corresponding RWE emulation.
| Study | Hazard Ratio (HR) | Log HR ($\theta$) | SE ($\sigma$) | Z-score | P-value |
|---|---|---|---|---|---|
| RCT | 0.81 | -0.21 | 0.053 | -3.96 | <0.0001 |
| RWE (pooled) | 0.88 | -0.128 | 0.052 | -2.46 | 0.007 |
Step-by-Step Calculation
To determine if the RWE truly “replicates” the RCT, we follow the logic of a rational sceptic who requires a significance level of $\alpha = 0.025$ ($z_{\alpha} = 1.96$).
1. Quantifying Sceptical Disbelief ($\tau^2$)
First, we determine the most extreme prior disbelief the RCT can survive. This “Sceptical Prior” centers its variance ($\tau^2$) on the strength of the original trial:
$$\tau^2 = \sigma_{RCT}^2 \times \left(\frac{z_{\alpha}}{|z_{RCT}|}\right)^2$$$$\tau^2 = 0.00281 \times \left(\frac{1.96}{3.96}\right)^2 \approx \mathbf{0.000688}$$2. Testing the Conflict ($t_{Box}$)
Next, we calculate the Box conflict test statistic. The denominator is “padded” by $\tau^2$ as a penalty for the original study’s uncertainty on top of the RWE’s own variance:
$$t_{Box} = \frac{\theta_{RWE}}{\sqrt{\tau^2 + \sigma_{RWE}^2}}$$$$t_{Box} = \frac{-0.128}{\sqrt{0.000688 + 0.00270}} = \frac{-0.128}{0.0582} \approx \mathbf{-2.20}$$3. Verdict and Sceptical P-Value ($p_s$)
- $p_{Box}$ Result: The one-sided p-value for $t_{Box} = -2.20$ is 0.014.
- Verdict: Since $0.014 < 0.025$, the RWE data significantly conflicts with the sceptic.
- The Tipping Point ($p_s$): By finding the $\alpha$ where $p_{Box}$ and $\alpha$ meet, we arrive at the Sceptical P-Value of 0.003. Replication is a SUCCESS.
Joint Credibility: More than the maximum of two p-values
While the RWE p-value alone was 0.007, the $p_s$ of 0.003 tells a more powerful story. Because the RCT was so precise, it effectively “lowered the bar” for the RWE. The joint evidence of both studies is significantly more convincing than either one viewed in isolation.
In contrast to the Two-Trials Rule, this approach is sensitive to both the effect size and variance (uncertainty) of each study, providing a more nuanced and rigorous assessment of replication success. Since the variance is inversely related to sample size per the Law of Large Numbers, it indirectly accounts for the difference between smaller trials and larger observational cohorts.
The Regulatory Shift
The timing of this methodological shift is critical. In February 2026, the FDA officially moved away from the “two-trial dogma,” allowing for more flexible evidence standards where RWE can serve as a second source of proof.
As shown in the table below, the Sceptical P-Value consistently outperforms traditional metrics in both sensitivity and power:
| Feature | Two-Trials Rule | Sceptical P-Value |
|---|---|---|
| Sensitivity to Effect Size | No | Yes |
| Sensitivity to Sample Size | No | Yes |
| Consistent (Superiority & NI) | Inconsistent | Yes |
| Predictive Power (RCT DUPLICATE) | 83.5% | 85.0% |
Documents
The paper is available here, and mirrored here. I served as the presentation lead, and the presentation slides are available here. Mr Bunjames Ngeth served as the commentator, and his commentary slides are available here.